年度
- 102
- 102
- 102
- 102
- 102
- 102
- 102
- 102
- 102
- 102
- 101
- 101
- 101
- 101
- 101
- 101
- 101
- 101
- 101
- 101
- 101
- 101
- 101
- 101
- 101
- 101
- 101
- 101
- 101
- 101
- 101
- 100
- 100
- 100
- 100
- 100
- 100
- 100
- 100
- 100
- 100
- 100
- 100
- 100
- 100
- 100
- 100
- 100
- 100
- 99
- 99
- 99
- 99
- 99
- 99
- 99
- 99
- 99
- 99
- 99
- 99
- 99
- 99
- 98
- 98
- 98
- 98
- 98
- 98
- 98
- 98
- 98
- 98
- 98
- 98
- 98
- 98
- 98
- 98
- 98
- 97
- 97
- 97
- 97
- 97
- 97
- 97
- 97
- 97
- 97
- 97
- 97
- 97
- 97
- 97
- 97
- 97
- 97
- 97
- 97
- 97
- 97
- 96
- 96
- 96
- 96
- 96
- 96
- 96
- 96
- 96
- 96
- 96
- 96
- 96
- 96
- 96
- 96
- 96
- 96

- 1.
The interquartile range is a suitable measure for the central tendency in
samples.
- 題型:是非題
- 難易度:尚未記錄
- 登入看解答
- 3.
The categorical explanatory variables in an experimental are often called
factors.
- 題型:是非題
- 難易度:尚未記錄
- 登入看解答
- 4.
If a sample has a mean of 78, a median of 65, and a mode of 50, then we
can say this sample is skewed to the left.
- 題型:是非題
- 難易度:尚未記錄
- 登入看解答
- 5.
The probability that a bull market occurs is 0.5 if equally likely events of
bull and bear markets are mutually exclusive and collectively exhaustive.
- 題型:是非題
- 難易度:尚未記錄
- 登入看解答
- 6.
The correlation coefficient can be used to measure linear and nonlinear
relationship between two random variables.
- 題型:是非題
- 難易度:尚未記錄
- 登入看解答
- 7.
If the mean, median and mode are the same in a data sample, then we can
say this sample is normally distributed.
- 題型:是非題
- 難易度:尚未記錄
- 登入看解答
- 8.
Random variables, X and Y, are independent. Then, variance of (X +Y ) is
equal to the variance of (X −Y ) .
- 題型:是非題
- 難易度:尚未記錄
- 登入看解答
- 9.
If random variable X has a variance larger than zero, then we can be
sure that E(X2 ) > E(X)2 .
- 題型:是非題
- 難易度:尚未記錄
- 登入看解答
- 10.
A randomized block (two-way) design with 5 treatments and 4 blocks
produced the following sum of squares values: Total sum of squares
SS(total) = 1800, SST (sum of squares for treatments) = 500, SSE (sum of
squares for error) = 400. Therefore, the value of MSB (mean square for
blocks) must be 300.
- 題型:是非題
- 難易度:尚未記錄
- 登入看解答
- 11.
A doorbell ring is distributed as a Bernoulli process with 0.5 while a clock
strike is distributed as a Bernoulli process with 0.25, then the distribution
of a doorbell ring and a clock strike at the same time is a Bernoulli process
with 0.125 if the doorbell ring and the clock strike are independent.
- 題型:是非題
- 難易度:尚未記錄
- 登入看解答
- 12.
When doing multiple comparisons in ANOVA, it is necessary to adjust the
overall critical value in order to avoid over-rejecting the null hypothesis
(Type I error).
- 題型:是非題
- 難易度:尚未記錄
- 登入看解答
- 13.
Examining the same population, David and Mary reached different sample
means and variances. They both think these differences are expected in
advance and attribute these differences to possible reasons, such as
sampling methods.
- 題型:是非題
- 難易度:尚未記錄
- 登入看解答
- 14.
When conducing mean equality test within two groups, one can choose
either ANOVA or t test. However, the t test is preferred if the test is
performed in a one-sided alternative.
- 題型:是非題
- 難易度:尚未記錄
- 登入看解答
- 15.
E(X) = ux and E(Y ) = uy . If random variables X and Y are independent,
then E(X +Y ) = ux + uy . Otherwise, this equality is not correct.
- 題型:是非題
- 難易度:尚未記錄
- 登入看解答
- 16.
150 firms were audited by the National Tax Bureau among 300 firms with
annual operating revenue under NT$50,000,000. Fundamentally, there are
200 more firms with annual operating revenue over NT$50,000,000.
Therefore, what is the probability of a company with annual operating
incoming under NT$50,000,000 will be audited by the National Tax
Bureau?- (A)
50%
- (B)
40%
- (C)
30%
- (D)
20%
- 題型:單選題
- 難易度:尚未記錄
- 登入看解答

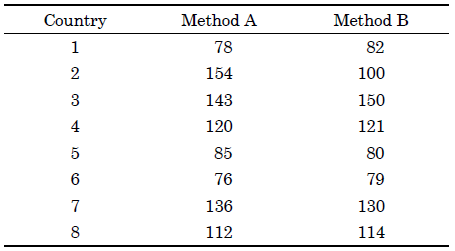
16 students coming from 8 countries (ie., 2 students from each country) joined a
language learning project in which two different methods were employed to
understand learning performance of each method. Assuming students coming
from the same country have the same language learning capabilities. The
following performance table is constructed by a TESOL researcher.
The TESOL researcher employed Wilcoxon Signed Rank test to find out
whether these two methods produced significantly different learning
performances.
- 18.
What is the sum of signed ranks?
- (A)
36
- (B)
2
- (C)
0
- (D)
18
- 題型:單選題
- 難易度:尚未記錄
- 登入看解答
16 students coming from 8 countries (ie., 2 students from each country) joined a
language learning project in which two different methods were employed to
understand learning performance of each method. Assuming students coming
from the same country have the same language learning capabilities. The
following performance table is constructed by a TESOL researcher.
The TESOL researcher employed Wilcoxon Signed Rank test to find out
whether these two methods produced significantly different learning
performances.
- 19.
What is the standard deviation of signed ranks?
- (A)
4.25
- (B)
6.12
- (C)
7.84
- (D)
5.39
- 題型:單選題
- 難易度:尚未記錄
- 登入看解答
16 students coming from 8 countries (ie., 2 students from each country) joined a
language learning project in which two different methods were employed to
understand learning performance of each method. Assuming students coming
from the same country have the same language learning capabilities. The
following performance table is constructed by a TESOL researcher.
The TESOL researcher employed Wilcoxon Signed Rank test to find out
whether these two methods produced significantly different learning
performances.
- 20.
Is there any statistically significant difference in learning performances
between method A and method B? (Hint: t(6, 0.975) = 2.447, t(7, 0.975) =
2.365, t(8, 0.975) = 2.306 and t(9, 0.975) = 2.262)- (A)
Method A > Method B
- (B)
Method A = Method B
- (C)
Method A < Method B
- (D)
indecisive
- 題型:單選題
- 難易度:尚未記錄
- 登入看解答
The duration a certain electronic appliance lasts can be modeled as an
exponential distribution with a mean of 100 hours.
- 21.
What is the probability of duration larger than120 hours:
- (A)
0.0040
- (B)
0.0030
- (C)
0.3012
- (D)
0.4161
- 題型:單選題
- 難易度:尚未記錄
- 登入看解答
The duration a certain electronic appliance lasts can be modeled as an
exponential distribution with a mean of 100 hours.
- 22.
Find the probability that 2 or more of 10 similar electronic appliances will
have a duration larger than 120 hours:- (A)
0.0386
- (B)
0.0292
- (C)
0.0328
- (D)
0.1197
- 題型:單選題
- 難易度:尚未記錄
- 登入看解答
The following table is prepared by a stock analyst regarding stocks and
associated returns.

- 23.
Which of the following statistical methods is not suitable to be used to
check whether stock return performances are significantly different in
years 1 and 2?- (A)
Kruskal-Wallis test
- (B)
Mann-Whitney-Wilcoxon test
- (C)
t test with independent samples
- (D)
all of above
- 題型:單選題
- 難易度:尚未記錄
- 登入看解答
The following table is prepared by a stock analyst regarding stocks and
associated returns.
- 24.
If this analyst decided to use the sign test to test whether these two groups
have different mean returns, what is the probability of test statistics under
the small sample size condition?- (A)
0.2341
- (B)
0.1325
- (C)
0.1445
- (D)
0.2124
- 題型:單選題
- 難易度:尚未記錄
- 登入看解答
The following table is prepared by a stock analyst regarding stocks and
associated returns.
- 25.
Based on information in question 9, what is value of the sign test statistic
under the large sample size condition?- (A)
–0.3145
- (B)
–1.0607
- (C)
–2.1231
- (D)
–3.1965
- 題型:單選題
- 難易度:尚未記錄
- 登入看解答

- 26.
What is the sample correlation coefficient between markets A and B?
- (A)
0.0341
- (B)
0.0354
- (C)
0.0362
- (D)
0.0371
- 題型:單選題
- 難易度:尚未記錄
- 登入看解答
- 27.
Is the correlation between markets A and B statistically significant using t
statistic?
t statistic significance- (A)
1.9457 Significant
- (B)
2.1235 Significant
- (C)
0.1095 Insignificant
- (D)
0.0965 Insignificant
- 題型:單選題
- 難易度:尚未記錄
- 登入看解答
- 28.
A stock analyst finds out that there is a 27% chance that the Taiwan stock
market increase when the American stock market increases. If this stock
analyst predicts that there is a 75% chance that the American stock
market increases next month, what is the probability that the Taiwan
stock market will increase as well?- (A)
0.1825
- (B)
0.0675
- (C)
0.5475
- (D)
0.2025
- 題型:單選題
- 難易度:尚未記錄
- 登入看解答

- 29.
What is the sample mean of weekly S&P 500 index returns? (The critical
values of normal distribution at significance levels of 2.5% and 5% equal
1.96 and 1.645, respectively, for the right tail)- (A)
0.012
- (B)
0.014
- (C)
0.016
- (D)
0.018
- 題型:單選題
- 難易度:尚未記錄
- 登入看解答
- 30.
If the standard deviation of weekly S&P 500 index returns is 5.4%, then
what is the new 95% confidence interval? (The critical values of normal
distribution at significance levels of 2.5% and 5% equal 1.96 and 1.645,
respectively, for the right tail)- (A)
0.0021 ≤ u ≤ 0.0215
- (B)
0.0023 ≤ u ≤ 0.0217
- (C)
0.0025 ≤ u ≤ 0.0219
- (D)
0.0027 ≤ u ≤ 0.0221
- 題型:單選題
- 難易度:尚未記錄
- 登入看解答
- 31.
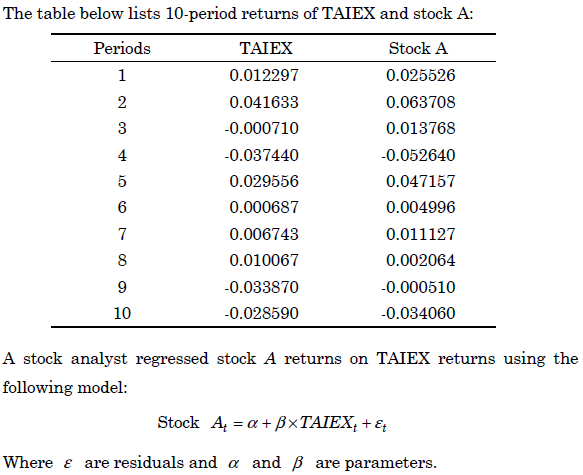
(a) What is the residual sum of squares in this regression?
(b) What is adjusted R-squared value?
(c) What is F test statistic value for testing β ?
(d) What is Durbin-Watson statistic value?
(e) If the estimation model is estimated using demeaned returns of stock A
and TAIEX, what is the estimated coefficient of α ?
- 題型:問答題
- 難易度:尚未記錄
- 32.

- 題型:問答題
- 難易度:尚未記錄