年度
- 100
- 100
- 100
- 100
- 100
- 100
- 100
- 100
- 100
- 100
- 100
- 100
- 100
- 100
- 100
- 100
- 100
- 100
- 100
- 100
- 100
- 100
- 99
- 99
- 99
- 99
- 99
- 99
- 99
- 99
- 99
- 99
- 99
- 99
- 99
- 99
- 99
- 99
- 99
- 98
- 98
- 98
- 98
- 98
- 98
- 98
- 98
- 98
- 98
- 98
- 98
- 98
- 98
- 98
- 98
- 98
- 98
- 98
- 98
- 98
- 98
- 98
- 97
- 97
- 97
- 97
- 97
- 97
- 97
- 97
- 97
- 97
- 97
- 97
- 97
- 97
- 97
- 97
- 97
- 97
- 97
- 97
- 97
- 97
- 97
- 97
- 96
- 96
- 96
- 96
- 96
- 96
- 96
- 96
- 96
- 96
- 96
- 96
- 96
- 96
- 96
- 96
- 96
- 96
- 96

- 1.
An estimator is said to be consistent if:
- (A)
it is an unbiased estimator
- (B)
the variance of the estimator is close to one
- (C)
the expected value of the estimator is known and positive
- (D)
it is an unbiased estimator and the difference between the estimator
and the population parameter grows smaller as the sample size grows
larger- (E)
None of the above
- 題型:單選題
- 難易度:尚未記錄
- 登入看解答
- 2.
Which of the following statements is NOT correct?
- (A)
The sample mean is an unbiased estimator of the population mean
- (B)
The sample proportion is an unbiased estimator of the population
proportion- (C)
The sample standard deviation is an unbiased estimator of the
population standard deviation- (D)
The difference between two sample means is an unbiased estimator of
the difference between two population means- (E)
None of the above
- 題型:單選題
- 難易度:尚未記錄
- 登入看解答
- 3.
The sample size needed to estimate a population mean within 2 units with
a 95% confidence when the population standard deviation equals 8 is?- (A)
62
- (B)
72
- (C)
82
- (D)
92
- (E)
None of the above
- 題型:單選題
- 難易度:尚未記錄
- 登入看解答
- 4.
The power of a test is denoted by: (for θ ∈H1 )
- (A)
β
- (B)
1 - β
- (C)
α
- (D)
1 - α
- (E)
χ 2
- 題型:單選題
- 難易度:尚未記錄
- 登入看解答
- 5.
A robust estimator is one that:
- (A)
is unbiased and symmetrical about zero
- (B)
is consistent and is also mound-shaped
- (C)
is efficient and less spread out
- (D)
is not sensitive to moderate departure from the assumption of normality
in the population- (E)
None of the above
- 題型:單選題
- 難易度:尚未記錄
- 登入看解答
- 6.
A sample of size 125 selected from one population has 55 successes, and a
sample of size 140 selected from a second population has 70 successes. The
test statistic for testing the equality of the population proportions equal to:- (A)
−0.060
- (B)
0.940
- (C)
−0.977
- (D)
−0.472
- (E)
None of the above
- 題型:單選題
- 難易度:尚未記錄
- 登入看解答
- 7.
To determine whether a single coin is fair, the coin was tossed 100 times,
and head was observed 60 times. The value of the test statistic is- (A)
2
- (B)
6
- (C)
20
- (D)
60
- (E)
None of the above
- 題型:單選題
- 難易度:尚未記錄
- 登入看解答

- 9.
In the two-way ANOVA where a is the number of factor A levels, b is
the number of factor B levels, and r in the number of replicates, the
number of degrees of freedom for interaction is:- (A)
ab − r
- (B)
abr −1
- (C)
(a −1)(b −1)(r −1)
- (D)
ab(r −1)
- (E)
None of the above
- 題型:單選題
- 難易度:尚未記錄
- 登入看解答
- 10.
A nonparametric method to compare two populations, when the samples
are matched pairs and the data are ordinal, is the:- (A)
Sign test
- (B)
Run test
- (C)
Wilcoxon rank sum test
- (D)
Mann-Whitney U test
- (E)
None of the above
- 題型:單選題
- 難易度:尚未記錄
- 登入看解答


- 14.
Which of the following is not an advantage of multiple regression as
compared with analysis of variance?- (A)
Multiple regression can be used to estimate the relationship between
the dependent variable and independent variables- (B)
Multiple regression handles problems with more than two independent
variables easier than analysis of variance- (C)
Multiple regression handles qualitative variables better than analysis of
variance- (D)
All of the above are advantages of multiple regression as compared with
analysis of variance- (E)
None of the above
- 題型:單選題
- 難易度:尚未記錄
- 登入看解答
- 15.

- (A)
Effect of x1 on y remains the same no matter what the value of x2
- (B)
Effect of x1 on y remains the same no matter what the value of x1
- (C)
Only difference in the four equations produced is the coefficient of x2
- (D)
Not enough information is given to answer this question
- (E)
None of the above
- 題型:單選題
- 難易度:尚未記錄
- 登入看解答
- 16.
Suppose that we want to model the randomized block design of the
analysis of variance with, say, three treatments and four blocks. How
many indicator variable should we create?- (A)
7 indicator variables
- (B)
5 indicator variables
- (C)
6 indicator variables
- (D)
4 indicator variables
- (E)
Nona of the above
- 題型:單選題
- 難易度:尚未記錄
- 登入看解答

- 18.
If X and Y are random variables with V(X) = 7.5 , V(Y ) = 6 and
COV(X,Y ) = 4 , then what is the value of V(2X + 3Y ) ?- (A)
133
- (B)
37
- (C)
88
- (D)
132
- (E)
None of the above
- 題型:單選題
- 難易度:尚未記錄
- 登入看解答
- 19.
Which of the following models might be appropriate to describe a new
product that has experienced a rapid early growth rate followed by the
inevitable leveling off?- (A)
Autoregressive model
- (B)
Linear model for long-term trend
- (C)
Quadratic model for long-term trend
- (D)
Lognormal model for long-term trend
- (E)
None of the above
- 題型:單選題
- 難易度:尚未記錄
- 登入看解答
- 20.
An investment firm has classified its clients according to their gender and
the composition of their investment portfolio (primarily bonds, primarily
stocks, or a balanced mix of bonds and stocks). The proportions of clients
falling into the various categories are shown in the following table. Please
find the probability that the employee selected is male, given that the
employee has an unbalanced portfolio.
- (A)
0.633
- (B)
0.625
- (C)
0.3968
- (D)
0.375
- (E)
None of the above
- 題型:單選題
- 難易度:尚未記錄
- 登入看解答
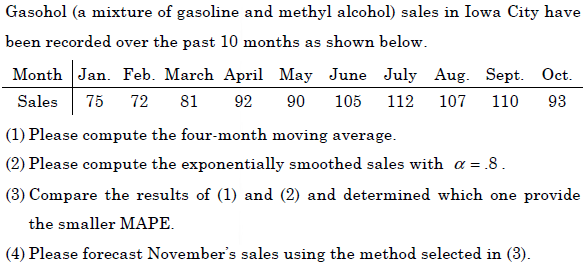
- 21.

- 題型:計算題
- 難易度:尚未記錄
- 22.

(1) What is the within groups degrees of freedom?
(2) What is the total number of degrees of freedom?
(3) What is the between group means square?
(4) What is the null hypothesis?
(5) At a significance level of 1%, What is the proper conclusion?
- 題型:計算題
- 難易度:尚未記錄
- 23.

(1) What is the coefficient of determination? Explain what this statistic
tells you about the model.
(2) Do these results allow us to conclude at the 5% significance level that
the model is useful in predicting the team’s winning percentage?
10
(3) Test to determine at the 10% significance level if the linear term and
the x2 term should be retained.
(4) Based on the result of (2) and (3), please predict the value of winning
team’s percentage with 12 years of professional experience.
- 題型:計算題
- 難易度:尚未記錄
- 24.
- 題型:計算題
- 難易度:尚未記錄