年度
- 102
- 102
- 102
- 102
- 102
- 102
- 102
- 102
- 102
- 102
- 101
- 101
- 101
- 101
- 101
- 101
- 101
- 101
- 101
- 101
- 101
- 101
- 101
- 101
- 101
- 101
- 101
- 101
- 101
- 101
- 101
- 100
- 100
- 100
- 100
- 100
- 100
- 100
- 100
- 100
- 100
- 100
- 100
- 100
- 100
- 100
- 100
- 100
- 100
- 99
- 99
- 99
- 99
- 99
- 99
- 99
- 99
- 99
- 99
- 99
- 99
- 99
- 99
- 98
- 98
- 98
- 98
- 98
- 98
- 98
- 98
- 98
- 98
- 98
- 98
- 98
- 98
- 98
- 98
- 98
- 97
- 97
- 97
- 97
- 97
- 97
- 97
- 97
- 97
- 97
- 97
- 97
- 97
- 97
- 97
- 97
- 97
- 97
- 97
- 97
- 97
- 97
- 96
- 96
- 96
- 96
- 96
- 96
- 96
- 96
- 96
- 96
- 96
- 96
- 96
- 96
- 96
- 96
- 96
- 96

- 1.
If X ~ N(μ ,σ 2 ) , then the interquartile range (IQR) of X is ______.
- (A)
1.35σ
- (B)
1.35σ2
- (C)
2σ
- (D)
2σ 2
- 題型:單選題
- 難易度:尚未記錄
- 登入看解答
- 2.
As you observe a normal probability plot for a random sample, if the plot
appears a nonlinear pattern with upward increasing manner, what does
the sample probably come from?- (A)
the population with a normal distribution
- (B)
the population with a left skewed probability distribution
- (C)
the population with a right skewed probability distribution
- (D)
the population with a rectangle probability distribution
- 題型:單選題
- 難易度:尚未記錄
- 登入看解答
- 3.
The main difference between the t and z statistic is that the t statistic
- (A)
is not normally distributed like the z statistic
- (B)
more variable than the z statistic
- (C)
is less variable than the z statistic
- (D)
has a mean of 1 and the z statistic has a mean of 0.
- 題型:單選題
- 難易度:尚未記錄
- 登入看解答
- 4.
A polling company finds a 99% confidence interval of 0.357 ±0.045 who
prefer a certain brand of soda over the competition. If the company wishes
to estimate its market share within 0.010 with a 99% confidence interval,
how many people would they need to sample in order to calculate the
market share for this new bound?- (A)
1345
- (B)
36490
- (C)
8630
- (D)
15953
- 題型:單選題
- 難易度:尚未記錄
- 登入看解答
- 5.
If a researcher conducted a hypothesis test and rejected the null hypothesis
at α = 0.05 , would the null hypothesis be rejected again at α = 0.01 ?- (A)
No, because the confidence interval has changed
- (B)
It may be rejected again, but it is not definite
- (C)
Yes, because the confidence interval is lower
- (D)
Yes, because the confidence interval is higher
- 題型:單選題
- 難易度:尚未記錄
- 登入看解答
- 6.
Which of the following is not an assumption that must be made when
performing a small-sample test for hypothesis (μ1 −μ2 ) independent
samples?- (A)
The samples are randomly and independently selected from the
population.- (B)
Both sampled populations have relative frequency distributions that are
approximately normal.- (C)
The mean of each of the samples is approximately equal to the mean of
the populations from which they are taken.- (D)
The population variances are equal.
- 題型:單選題
- 難易度:尚未記錄
- 登入看解答


- 9.
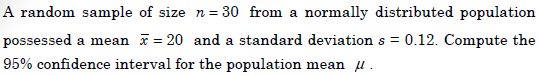
- (A)
(18.9555, 21.1445)
- (B)
(19.9552, 20.0448)
- (C)
(19.0112, 20.9888)
- (D)
(18.0165, 21.9835)
- 題型:單選題
- 難易度:尚未記錄
- 登入看解答
- 10.

- (A)
(0.103, 0.144)
- (B)
(0.096, 0.161)
- (C)
(0.011, 0.119)
- (D)
(0.016, 0.121)
- 題型:單選題
- 難易度:尚未記錄
- 登入看解答
Two samples each of size 25 are taken from independent populations assumed
to be normally distributed with equal variances. The first sample has a mean
of 35.5 and standard deviation of 3.0 while the second sample has a mean of
33.0 and standard deviation of 4.0.
- 11.
The pooled sample variance is ________.
- (A)
3.5
- (B)
12.25
- (C)
12.5
- (D)
15
- 題型:單選題
- 難易度:尚未記錄
- 登入看解答
Two samples each of size 25 are taken from independent populations assumed
to be normally distributed with equal variances. The first sample has a mean
of 35.5 and standard deviation of 3.0 while the second sample has a mean of
33.0 and standard deviation of 4.0.
- 12.
What is the 95% confidence interval estimate for the difference in the two
population means?- (A)
(0.5412, 4.4637)
- (B)
(0.4894, 4.5106)
- (C)
(0.4405, 4.5595)
- (D)
(0.1861, 4.8139)
- 題型:單選題
- 難易度:尚未記錄
- 登入看解答
Two samples each of size 25 are taken from independent populations assumed
to be normally distributed with equal variances. The first sample has a mean
of 35.5 and standard deviation of 3.0 while the second sample has a mean of
33.0 and standard deviation of 4.0.
- 13.

- (A)
(0.2479, 1.2765)
- (B)
(0.4894, 4.5106)
- (C)
(0.4405, 4.5595)
- (D)
(0.7834, 4.0343)
- 題型:單選題
- 難易度:尚未記錄
- 登入看解答

- 14.
If you conduct the one-way ANOVA for the data, the among-group
variation or SSA is ________.- (A)
0.7955
- (B)
3.181875
- (C)
1.1825
- (D)
3.568875
- 題型:單選題
- 難易度:尚未記錄
- 登入看解答
- 15.
Given the total variation SST = 4.364375, the ANOVA F statistic is
________.- (A)
0.729
- (B)
1.084
- (C)
10.763
- (D)
3.271
- 題型:單選題
- 難易度:尚未記錄
- 登入看解答
- 16.
When we perform the ANOVA F test, what will be the conclusion?
- (A)
At the 0.05 level of significance, the mean ratios for the 4 neighborhoods
are not all the same.- (B)
At the 0.01 level of significance, the mean ratios for the 4 neighborhoods
are all the same.- (C)
At the 0.10 level of significance, the mean ratios for the 4 neighborhoods
are not significantly different.- (D)
At the 0.05 level of significance, the mean ratios for the 4 neighborhoods
are not significantly different from 0.
- 題型:單選題
- 難易度:尚未記錄
- 登入看解答
An economist is interested to see how consumption for an economy (in $
billions) is influenced by gross domestic product ($ billions) and aggregate
price (consumer price index). The Microsoft Excel output of this regression is
partially reproduced below.

- 17.
When the economist used a simple linear regression model with
consumption as the dependent variable and GDP as the independent
variable, he obtained an r2 value of 0.971. What additional percentage of
the total variation of consumption has been explained by including
aggregate prices in the multiple regression?- (A)
98.2
- (B)
11.1
- (C)
2.8
- (D)
1.1
- 題型:單選題
- 難易度:尚未記錄
- 登入看解答
An economist is interested to see how consumption for an economy (in $
billions) is influenced by gross domestic product ($ billions) and aggregate
price (consumer price index). The Microsoft Excel output of this regression is
partially reproduced below.
- 18.
To test whether aggregate price index has a negative impact on
consumption, the P-value is ________?- (A)
0.0001
- (B)
0.4165
- (C)
0.8330
- (D)
0.8837
- 題型:單選題
- 難易度:尚未記錄
- 登入看解答

- 19.
Compute the χ 2 statistic for the contingency table.
- (A)
3.8415
- (B)
5.9418
- (C)
9.4877
- (D)
13.2767
- 題型:單選題
- 難易度:尚未記錄
- 登入看解答
- 20.
When we perform the Chi-square test for the contingency table, what will
be the conclusion?- (A)
At the 0.05 level of significance, brand awareness of female TV viewers
and the gender of the spokesperson are independent.- (B)
At the 0.05 level of significance, brand awareness of female TV viewers
and the gender of the spokesperson are not independent.- (C)
At the 0.01 level of significance, brand awareness of female TV viewers
and the gender of the spokesperson are significantly dependent- (D)
At the 0.01 level of significance, brand awareness of female TV viewers
and the gender of the spokesperson are related.
- 題型:單選題
- 難易度:尚未記錄
- 登入看解答
- 21.

- 題型:計算題
- 難易度:尚未記錄
- 22.

(a) 試建立二因子變異數分析表。(12%)
(b) 試以5%顯著水準,分別檢定年齡層、廣告形式、交互作用對於該化妝品購買
意向之影響效果。(8%)
- 題型:計算題
- 難易度:尚未記錄