年度
- 100
- 100
- 100
- 100
- 100
- 100
- 100
- 100
- 100
- 100
- 100
- 100
- 100
- 100
- 100
- 100
- 100
- 99
- 99
- 99
- 99
- 99
- 99
- 99
- 99
- 99
- 99
- 99
- 99
- 99
- 99
- 99
- 99
- 99
- 99
- 99
- 99
- 99
- 99
- 99
- 99
- 98
- 98
- 98
- 98
- 98
- 98
- 98
- 98
- 98
- 98
- 98
- 98
- 98
- 98
- 98
- 98
- 98
- 98
- 98
- 98
- 98
- 98
- 98
- 98
- 98
- 98
- 98
- 98
- 98
- 98
- 98
- 98
- 97
- 97
- 97
- 97
- 97
- 97
- 97
- 97
- 97
- 97
- 97
- 97
- 97
- 97
- 97
- 97
- 97
- 97
- 97
- 97
- 97
- 97
- 97
- 97
- 97
- 97
- 97
- 97
- 96
- 96
- 96
- 96
- 96
- 96
- 96
- 96
- 96
- 96
- 96
- 96
- 96
- 96
- 96
- 96
- 96
- 96
- 96
- 96
- 96
- 96
- 96
- 96
- 96
- 96
- 96
- 96
- 96
- 96
- 96

- 1.
A small town has a “Pick 3” game in which you pick one of the 1000 3-digit numbers
between 000 and 999, receiving $2750 for a winning $10 bet and nothing otherwise. (15%)
(1) Construct the probability distribution of the random variable X = winnings. (5%)
(2) Find the mean and variance of the probability distribution. (6%)
(3) Based on part (2) and the $10 cost to play the game, on average, how much can you
expected to lose each time you play this lottery? (4%)
- 題型:問答題
- 難易度:尚未記錄
- 2.
A fast-food chain wants to compare two ways of promoting a new turkey burger. One
way uses a coupon available in the store. The other way uses a poster display outside the
store. Before the promotion, their marketing research group matches 50 pairs of stores.
Each pair has two stores with similar sales volume and customer demographics. The
store in a pair that uses coupons is randomly chosen, and after a month-long promotion,
the increases in sales of the turkey burger are compared for the two stores. (30%)
(1) The increase was higher for 28 stores using coupons and higher for 22 stores using
the poster. Is this strong evidence to support the coupon approach? Make a decision
using a 0.05 significance level. (8%)
(2) Find and interpret the P-value for this test. (6%)
(3) In a separate experiment with 10 pairs of stores, the difference in the month’s
increased sales between the store that used coupons and the store with outside
poster had a mean of $3000 and standard deviation $4000. Does this indicate a true
difference between mean sales for the two advertising approaches? Make a decision
using a 0.05 significance level. (8%)
(4) Refer to part (2). Please first construct a 95% confidence interval for the difference
between mean sales for the two advertising approaches, and then compare this
result with that of part (3). (8%)
- 題型:問答題
- 難易度:尚未記錄
- 3.
A tax assessor wants to estimate the mean property tax bill for all homeowners in a
small town. A survey ten years ago got a sample mean and standard deviation of $1400
and $1000, respectively. (20%)
(1) How many tax records should the tax processor randomly sample in order for a
95% confidence interval for the mean to have a margin error equal to $100? (6%)
(2) In reality, suppose that they’d now got a standard deviation equal to $1500. Using
the sample size you derived in part (1), please find the margin of error. Explain
whether and why this margin of error would be less $100, equal to $100, or more
than $100. (7%)
(3) Refer to part (2). What is the probability that the sample mean falls within $100 of
the population mean? Explain whether and why this probability would be less 0.95,
equal to 0.95, or more than 0.95. (7%)
- 題型:問答題
- 難易度:尚未記錄
- 4.
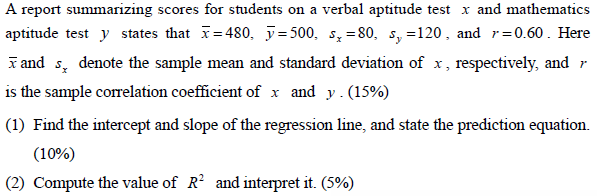
- 題型:問答題
- 難易度:尚未記錄
- 5.
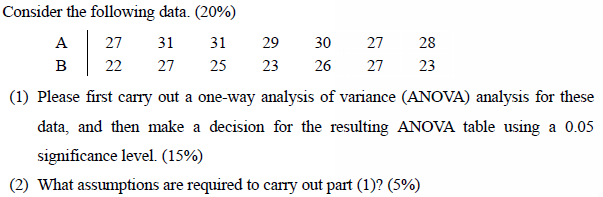
- 題型:問答題
- 難易度:尚未記錄