年度
- 100
- 100
- 100
- 100
- 100
- 100
- 100
- 100
- 100
- 100
- 100
- 100
- 100
- 100
- 100
- 100
- 100
- 99
- 99
- 99
- 99
- 99
- 99
- 99
- 99
- 99
- 99
- 99
- 99
- 99
- 99
- 99
- 99
- 99
- 99
- 99
- 99
- 99
- 99
- 99
- 99
- 98
- 98
- 98
- 98
- 98
- 98
- 98
- 98
- 98
- 98
- 98
- 98
- 98
- 98
- 98
- 98
- 98
- 98
- 98
- 98
- 98
- 98
- 98
- 98
- 98
- 98
- 98
- 98
- 98
- 98
- 98
- 98
- 97
- 97
- 97
- 97
- 97
- 97
- 97
- 97
- 97
- 97
- 97
- 97
- 97
- 97
- 97
- 97
- 97
- 97
- 97
- 97
- 97
- 97
- 97
- 97
- 97
- 97
- 97
- 97
- 96
- 96
- 96
- 96
- 96
- 96
- 96
- 96
- 96
- 96
- 96
- 96
- 96
- 96
- 96
- 96
- 96
- 96
- 96
- 96
- 96
- 96
- 96
- 96
- 96
- 96
- 96
- 96
- 96
- 96
- 96

- 1.
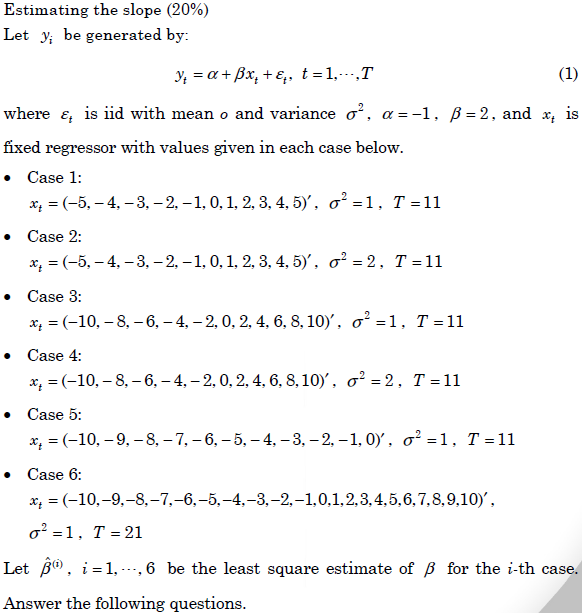
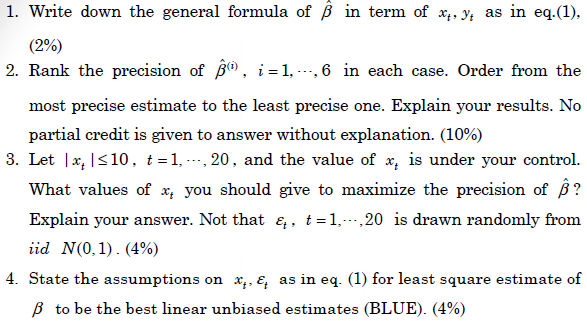
- 題型:問答題
- 難易度:尚未記錄
- 2.
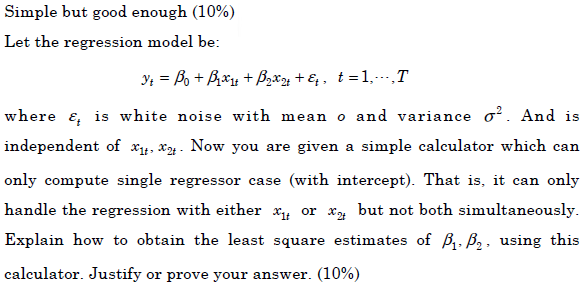
- 題型:問答題
- 難易度:尚未記錄
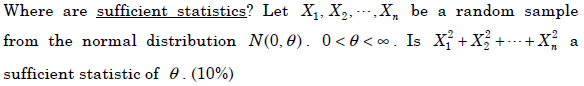
- 3.
Is it worth it? (20%)
To answer the question where it is worth studying for the master degree,
you are given a dataset containing 1000 samples. For each sample, the
variables included are education level (EDU: bachelor, master), monthly
salary (INC: 0~1,000,000), gender (Gen: male, female), occupation (OCC:
lawyer, teacher, physician, engineer, technician, business professional,
others), working location (LOC: rural, urban), working experiences (WORK:
years), religious belief (REL: none, Buddhist, Christian, others).
1. A raw estimate of the value of the master degree is the difference
between the average salary for those who have bachelor degree and
those who have master degree. How good is this raw estimate? Explain.(4%)
2. Write down the regression model for the raw estimate above. (Hint: let
EDU = 0 for bachelor and 1 for master.) (4%)
3. Write down the complete regression model including all regressors
listed above. How do you test if your model is an appropriate one? Be
specific about the null hypothesis, the test statistics and its distribution.(4%)
4. How do you test if the master degree significantly increases the
monthly salary? Be specific about the null hypothesis, the test statistics
and its distribution. (4%)
5. Some people argue that the value of master degree differs among
different occupations. How do you test for this argument? Be specific
about the null hypothesis, model specification, test statistics and its
distribution. (4%)
- 題型:問答題
- 難易度:尚未記錄
- 4.
a. A significance test is performed and the p-value = 0.20. Why can’t we
claim that the probability that the null hypothesis is true is 0.20? (5%)
b. What is a standard error and why is it important? (5%)
c. Is it possible for a statistic to be unbiased yet be very inefficient? How
about being very efficient but biased? (5%)
d. What is the most difficult step in estimating power? (5%)
- 題型:問答題
- 難易度:尚未記錄
- 5.
Assume four normally distributed populations with means of 10, 11, 12,
and 13 all with the same standard deviation of 2. Four subjects are
sampled from each population and the mean of each sample computed.
What is the probability that average of the means of the samples from
Populations 1 and 3 will be greater than the average of the means of the
samples from Populations 2 and 4? (10%)
- 題型:問答題
- 難易度:尚未記錄
- 6.
A person claims to be able to throw a die and make a 1 come up more often
than chance (1/6). The die is thrown 100 times and a one comes up 18
times. Do you agree with the person’s statement? (10%)
- 題型:問答題
- 難易度:尚未記錄
- 7.
- 題型:問答題
- 難易度:尚未記錄