年度
- 100
- 100
- 100
- 100
- 100
- 100
- 100
- 100
- 100
- 100
- 100
- 100
- 100
- 100
- 100
- 100
- 100
- 100
- 100
- 100
- 100
- 100
- 100
- 100
- 100
- 100
- 100
- 100
- 100
- 100
- 100
- 100
- 100
- 100
- 100
- 100
- 100
- 100
- 100
- 100
- 100
- 100
- 100
- 100
- 100
- 100
- 100
- 100
- 100
- 100
- 100
- 100
- 100
- 100
- 99
- 99
- 99
- 99
- 99
- 99
- 99
- 99
- 99
- 99
- 99
- 99
- 99
- 99
- 99
- 99
- 99
- 99
- 99
- 99
- 99
- 99
- 99
- 99
- 99
- 99
- 99
- 99
- 99
- 99
- 99
- 99
- 99
- 99
- 99
- 99
- 99
- 99
- 99
- 99
- 99
- 99
- 99
- 99
- 99
- 99
- 99
- 99
- 99
- 99
- 99
- 98
- 98
- 98
- 98
- 98
- 98
- 98
- 98
- 98
- 98
- 98
- 98
- 98
- 98
- 98
- 98
- 98
- 98
- 98
- 98
- 98
- 98
- 98
- 98
- 98
- 98
- 98
- 98
- 98
- 98
- 98
- 98
- 98
- 98
- 98
- 98
- 98
- 98
- 98
- 98
- 98
- 98
- 98
- 98
- 98
- 98
- 98
- 98
- 98
- 98
- 98
- 98
- 98
- 98
- 98
- 98
- 98
- 98
- 98
- 98
- 98
- 98
- 98
- 98
- 98
- 98
- 97
- 97
- 97
- 97
- 97
- 97
- 97
- 97
- 97
- 97
- 97
- 97
- 97
- 97
- 97
- 97
- 97
- 97
- 97
- 97
- 97
- 97
- 97
- 97
- 97
- 97
- 97
- 97
- 97
- 97
- 97
- 97
- 97
- 97
- 97
- 97
- 97
- 97
- 97
- 97
- 97
- 97
- 97
- 97
- 97
- 97
- 97
- 97
- 97
- 97
- 97
- 97
- 97
- 97
- 97
- 97
- 97
- 97
- 97
- 97
- 97
- 97
- 97
- 97
- 97
- 97
- 97
- 97
- 97
- 96
- 96
- 96
- 96
- 96
- 96
- 96
- 96
- 96
- 96
- 96
- 96
- 96
- 96
- 96
- 96
- 96
- 96
- 96
- 96
- 96
- 96
- 96
- 96
- 96
- 96
- 96
- 96
- 96
- 96
- 96
- 96
- 96
- 96
- 96
- 96
- 96
- 96
- 96
- 96
- 96
- 96
- 96
- 96
- 96
- 96
- 96
- 96
- 96
- 96
- 96
- 96
- 96
- 96
- 96
- 96
- 96
- 96
- 96
- 96
- 96
- 96
- 96
- 96
- 96
- 96
- 96
- 96
- 96
- 96
- 96
- 96
- 96
- 96
- 96
- 96
- 96


- 1.
In the above figure, the government has imposed a tax on sellers of pizza. The amount
of the tax
- (A)
is $40.
- (B)
is $10.
- (C)
is $30.
- (D)
connot be determined without more informaiton.
- 題型:單選題
- 難易度:尚未記錄
- 登入看解答
- 2.
In the above figure, the government has imposed a tax on sellers of pizza. The tax
increases- (A)
the amount received by sellers by $30
- (B)
the price paid by buyers by $30.
- (C)
the quantity of pizza sold from 40 million per year to 60 million per year.
- (D)
the after-tax price by $40.
- 題型:單選題
- 難易度:尚未記錄
- 登入看解答
- 3.
In the above figure, the government has imposed a tax on sellers of pizza. After the tax
has been imposed, the after-tax price of a pizza is _______ and the eauilibrium
quantity is _______ per year.- (A)
$20; 40 million
- (B)
$10; 60 million
- (C)
$20; 20 million
- (D)
$30; 20 million
- 題型:單選題
- 難易度:尚未記錄
- 登入看解答
- 4.

Suppose the government has declared beer to be an illegal substance and has imposed
eaual penalties on any person caught buying a beer and on any person caugh selling a
beer. Using the above figure, in which CBL is the cost of breaking the law, by how
much is beer consumption decreased by the penalties?- (A)
Beer consumption is decreased by 200 quarts.
- (B)
Beer consumption is decreased by 400 quarts.
- (C)
Beer consumption is decreased by 300 quarts.
- (D)
Beer consumption is decreased by 500 quarts.
- 題型:單選題
- 難易度:尚未記錄
- 登入看解答
- 5.
Which of the following is a correct statement about markets for prohibited goods?
- (A)
Taxing a good at a sufficiently high rate can achieve the same consumption level as
prohibition.- (B)
Penalizing sellers of an illegal good decreases supply and penalizing buyers
decreases demand.- (C)
Penalizing either buyers or sellers of an illegal good decrease the quantity bought.
- (D)
All of the above are correct statements.
- 題型:單選題
- 難易度:尚未記錄
- 登入看解答
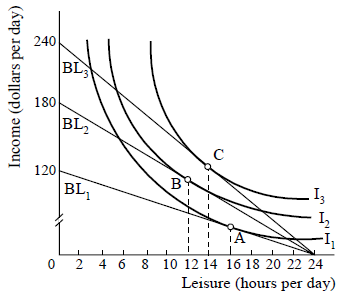
- 6.
In the above figure, when his wage rate increases from $5.00 to $7.50 per hour, which
of the following does Bob experience?- (A)
a change in has preferences
- (B)
an increase in the opportunity cost of leisure
- (C)
an increase in the opportunity cost of working
- (D)
all of the above
- 題型:單選題
- 難易度:尚未記錄
- 登入看解答
- 7.
In the above figure, when the wage rate increases from $5.00 to $7.50 an hour, Bob
chooses less leisure because of- (A)
the substitution effect.
- (B)
the income effect.
- (C)
both of the above
- (D)
neither of the above
- 題型:單選題
- 難易度:尚未記錄
- 登入看解答
- 8.
Market power is the
- (A)
political power of monopolies.
- (B)
size of the market.
- (C)
forces of supply and demand.
- (D)
ability of a firm to set its price.
- 題型:單選題
- 難易度:尚未記錄
- 登入看解答
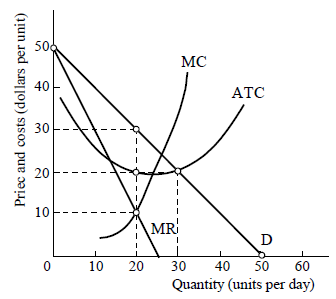
- 9.
The figure above shows the demand and cost curves for a single-price monopolist.
What level of output maximizes the firm’s economic profit?- (A)
0 units
- (B)
30 units
- (C)
20 units
- (D)
50 units
- 題型:單選題
- 難易度:尚未記錄
- 登入看解答
- 10.
The figure above shows the demand and cost curves for a single-price monopolist.
What price will the firm charge?- (A)
$50 per unit
- (B)
$30 per unit
- (C)
$10 per unit
- (D)
$20 per unit
- 題型:單選題
- 難易度:尚未記錄
- 登入看解答
- 11.
The figure above shows the demand and cost curves for a single-price monopolist.
What economic profit does this firm earm?- (A)
$400
- (B)
$200
- (C)
zero
- (D)
$600
- 題型:單選題
- 難易度:尚未記錄
- 登入看解答

- 12.
Dell and Gateway must decide whether to lower their prices, based on the potential
profits shown in the payoff matrix above. (The profits are in millions of dollars.) In the
Nash equilibrium,- (A)
both Dell and Gateway lower prices.
- (B)
Dell keeps its prices high and Gateway lowers its prices.
- (C)
Gateway keeps its prices high and Dell lowers its prices.
- (D)
both Dell and Gateway keep prices high.
- 題型:單選題
- 難易度:尚未記錄
- 登入看解答
- 13.
Dell and Gateway must decide whether to lower their prices, based on the potential
profits shown in the payoff matrix above. (The profits are in millions of dollars.) In the
Nash equilibrium, Dell’s profit is _______ million and Gateway’s profit is _______
million.- (A)
5; 20
- (B)
15; 15
- (C)
10; 10
- (D)
20; 5
- 題型:單選題
- 難易度:尚未記錄
- 登入看解答
- 14.
Dell and Gatway must decide whether to lower their prices, based on the potential
profits shown in the payoff matrix above. (The profits are in millions of dollars.) If the
firms collude and don’t cheat, Dell’s profit is _______ million and Gateway’s profit
is ________ million.- (A)
5; 20
- (B)
15; 15
- (C)
10; 10
- (D)
20; 5
- 題型:單選題
- 難易度:尚未記錄
- 登入看解答
- 15.

The firm shown in the figure above is
- (A)
not a natural monopoly because its MC curve is below its ATC curve.
- (B)
not a natural monopoly because its MC curve is horizontal.
- (C)
not a natural monopoly because its ATC curve slopes downward where it intersets
the demand curve.- (D)
a natural monopoly because its ATC curve slopes downward where it intersects the
demand curve.
- 題型:單選題
- 難易度:尚未記錄
- 登入看解答

- 16.
In the above figure, the utility of wealth curve shown indicated that individual is
- (A)
risk averse.
- (B)
risk preferrinig.
- (C)
risk neutral.
- (D)
risk averse of risk neutral, depending on income.
- 題型:單選題
- 難易度:尚未記錄
- 登入看解答
- 17.
The above figure show how an individual evaluates a bet in which he or she has a 0.5
probatility of receiving $20 and a 0.5 probability of receiving $200. The individual
would be indifferent between.- (A)
$200 with certainty or the expected value of the bet.
- (B)
$20 with certainty or the expected value of the bet.
- (C)
$110 with certainty and the expected value of the bet.
- (D)
$80 with certainty or the expected value of the bet.
- 題型:單選題
- 難易度:尚未記錄
- 登入看解答

- 18.
James has a utility of wealth schedule in the above table. He is offered a job selling
video games at Games Galore. James’ compensation depends on how much he sells. In
a poor sales period, a salesperson makes $100 per month. In a good sales period, a
salesperson makes $600 per month. James is told by the manager that, in any given
month, there is a 25 percent chance of a poor sales period and a 75 percent chance of a
good sales period. What is James’ expected income from taking this job?- (A)
$600
- (B)
$350
- (C)
$475
- (D)
$100
- 題型:單選題
- 難易度:尚未記錄
- 登入看解答
- 19.
James has a utility of wealth schedule in the above table. He is offered a job selling
video games at Games Galore. James’ compensation depends on how much he sells. In
a poor sales period, a salesperson makes $100 per month. In a good sales period, a
salesperson makes $600 per month. James is told by the manager that, in any given
month, there is a 25 percent chance of a poor sales period and a 75 percent chance of a
good sales period. What is James’ expected utility from taking this job?- (A)
150
- (B)
175
- (C)
100
- (D)
200
- 題型:單選題
- 難易度:尚未記錄
- 登入看解答
- 20.

Based on the above figure that shows the pre-trade PPFs for the nations of Utopia and
Apogee, when trade begins between Utopia and Apogee, it will be profitable
I. for Utopia to export cars. II. for Utopia to export trucks.
III. for Apogee to export cars.- (A)
I and III
- (B)
I only
- (C)
II only
- (D)
II and III
- 題型:單選題
- 難易度:尚未記錄
- 登入看解答

- 21.
In the above figure, flow E represents ________.
- (A)
government borrowing
- (B)
government lending
- (C)
net taxes
- (D)
household borrowing
- 題型:單選題
- 難易度:尚未記錄
- 登入看解答
- 22.
In the above figure, flow B represents ________ .
- (A)
household borrowing
- (B)
household income
- (C)
household purchases of goods and servies
- (D)
firms’ payments for labor sevices
- 題型:單選題
- 難易度:尚未記錄
- 登入看解答

- 23.
Using the information in the table above, calculate gross domestic procuct.
- (A)
$4,690 billion
- (B)
$5,130 billion
- (C)
$5,320 billion
- (D)
$4,760 billion
- 題型:單選題
- 難易度:尚未記錄
- 登入看解答
- 24.
Using the information if the table above, net exports equals.
- (A)
$20 billion.
- (B)
−$70 billion.
- (C)
$650 billion.
- (D)
$1,370 billion.
- 題型:單選題
- 難易度:尚未記錄
- 登入看解答
- 25.
Using the information in the table above, depreciation equals
- (A)
$90 billion.
- (B)
−$70 billion.
- (C)
−$90 billion.
- (D)
some amount that cannot be determined.
- 題型:單選題
- 難易度:尚未記錄
- 登入看解答

- 26.
The information is the table above gives the 2004 reference base period CPI basket and
prices used to construct the CPI for a small nation. It also has the 2005 prices. What is
the value of the CPI for the reference base period, 2004?- (A)
75
- (B)
140
- (C)
100
- (D)
133
- 題型:單選題
- 難易度:尚未記錄
- 登入看解答
- 27.
The information in the table above gives the 2004 reference base period CPI basket and
prices used to construct the CPI for a small nation. It also has the 2005 prices. What is
the value of the CPI for 2005?- (A)
133
- (B)
140
- (C)
100
- (D)
75
- 題型:單選題
- 難易度:尚未記錄
- 登入看解答
- 28.
Suppose the CPI in 2004 = 121 and the CPI in 2005 = 137. The correct method to
calculate the inflation rate is- (A)

- (B)

- (C)

- (D)
137×121= 258
- 題型:單選題
- 難易度:尚未記錄
- 登入看解答
- 29.

According to the table above, the value of M1 is _______and the value of M2
is ________ .- (A)
$805 billion; $2,490 billion
- (B)
$813 billion ; $3,303 billion
- (C)
$1,488 billion ; $3,978 billion
- (D)
$813 billion; $2,490 billion
- 題型:單選題
- 難易度:尚未記錄
- 登入看解答
- 30.
Which of the following is NOT money?
- (A)
checks in the checkbook
- (B)
checking deposits
- (C)
currency
- (D)
All of the above are money
- 題型:單選題
- 難易度:尚未記錄
- 登入看解答
- 31.
Which of the following is true?
I. Checks are considered money because they can be used as a medium of exchange.
II. Checks repressent a transfer of money.- (A)
I only
- (B)
neither I nor II
- (C)
II only
- (D)
both I and II
- 題型:單選題
- 難易度:尚未記錄
- 登入看解答
- 32.
Credit cards are
- (A)
a part of M1 but not of M2.
- (B)
not a part of money because they are not a means of payment.
- (C)
a part of M2 but not a part of M1.
- (D)
a part of money because they are used to purchase goods and services.
- 題型:單選題
- 難易度:尚未記錄
- 登入看解答

- 33.
In the above figure, suppose the economy is at point D. Which of the following occurs
as a result of an open market purchase of bonds?- (A)
an increase in exports
- (B)
a decrease in interest rates
- (C)
an increase in investment
- (D)
All of the above occur
- 題型:單選題
- 難易度:尚未記錄
- 登入看解答
- 34.
In the above figure, suppose the economy was initially in an equilibrium at point A. In
the short run, where would the economy move if the Fed makes an open market
purchase of bonds?- (A)
A, that is, the economy would not change its equilibrium.
- (B)
B
- (C)
C
- (D)
D
- 題型:單選題
- 難易度:尚未記錄
- 登入看解答
- 35.
In the above figure, suppose the economy is at a short run equilibrium at point B.
Which of the following policy options for the Fed will move the economy toward its
LAS?- (A)
lowering the required reserve ratio
- (B)
open market sale of bonds
- (C)
lowering the discount rate
- (D)
None of the above policy options will move the economy toward its LAS.
- 題型:單選題
- 難易度:尚未記錄
- 登入看解答

- 36.
In the above table, C is consumption expenditure, I is investment, G is govenment
purchases, X is exports, and M is imports. All entries are in dollars. What is the
marginal propensity to consume?- (A)
0.75
- (B)
0.25
- (C)
0.80
- (D)
0.20
- 題型:單選題
- 難易度:尚未記錄
- 登入看解答
- 37.
In the above table, C is consumption expenditure, I is investment, G is government
purchases, X is exports, and M is imports. All entries are in dollars. What is the level of
aggregate planned expenditure when real GDP is equal to $900 billion?- (A)
$675
- (B)
$796
- (C)
$1,714
- (D)
$814
- 題型:單選題
- 難易度:尚未記錄
- 登入看解答
- 38.
In the above table, C is consumption expenditure, I is investment, G is government
purchases, X is exports, and M is imports. All entries are in dollars. What is the
unplanned inventory change when GDP is equal to $400?- (A)
$26
- (B)
−$5
- (C)
-$26
- (D)
$5
- 題型:單選題
- 難易度:尚未記錄
- 登入看解答
- 39.
Inthe above table, C is consumption expenditure, I is investment, G is government
purchases, X is exports, and M is imports. All entries are in dollars. What is the
equilibrium expenditure?- (A)
$200
- (B)
$1,000
- (C)
$500
- (D)
$700
- 題型:單選題
- 難易度:尚未記錄
- 登入看解答
- 40.
In the above table, C is consumption expenditure, I is investment, G is government
purchases, X is exports, and M is imports. All entries are in dollars. If investment were
to increase by $26 to a level of $51 then equilibrium expenditure will- (A)
increase by $25.
- (B)
decrease by $100.
- (C)
increase by $100.
- (D)
decrease by $50.
- 題型:單選題
- 難易度:尚未記錄
- 登入看解答